
Katherine Thornton, Otemon Gakuin University, Japan
Nao Noguchi, Otemon Gakuin University, Japan
Thornton, K., & Noguchi, N. (2016). Building a picture of usage patterns in a language learning space: Gathering useful quantitative and qualitative data. Studies in Self-Access Learning Journal, 7(4), 412-425. https://doi.org/10.37237/070409
Download paginated PDF version
Abstract
While evaluation of a language learning space can be a difficult undertaking, it is possible to design evaluation instruments that both satisfy institutional demands for numeric data and also provide useful information that can be used to improve the space. This paper reports on the implementation, one quantitative and one qualitative, of two evaluation instruments at a small and relatively new self-access centre in Osaka, Japan. The area counting system gives rich data about how students are using the space, while the user experience survey provides much valued learner voices on different aspects of the space and its mission. Examples are given from the findings and how this data can be utilised to enhance the space itself.
Keywords: self-access evaluation, self-access management
In the highly competitive market that higher education has become in many countries around the world, managers of a language learning space (LLS) need to continually justify its position in an institution. However, evaluation is not only important to demonstrate return on investment. It is also vital for LLS managers to get a deeper understanding of the impact the centre and its activities are having on users’ learning experiences, and the extent to which the LLS accomplishing its mission. However, Morrison (2005) points out how difficult it is to effectively evaluate such complicated spaces in which numerous activities are taking place, where different stakeholders place different emphasis on what should be evaluated and where it can be challenging to control for numerous variables. This view is emphasised by others in the field (Gardner, 1999; Reinders & Lazaro, 2008; Riley, 1996).
This paper describes two evaluation initiatives used at an LLS in a university in Japan. A quantitative measure to collect data on user numbers has been adapted to give a more detailed picture of how the space is used. The picture of LLS usage that the tool reveals is then triangulated with qualitative data from a user survey, which provides an even more nuanced understanding of the space.
Analysing the data collected over time has enabled the authors (the director of the centre and its administrator) to develop a more detailed picture of how the LLS is contributing to the learning experience of its users, and which aspects of it need more attention. As Gardner and Miller (2015) recommend, the data gathered from the tools described in this paper is used for making decisions about the centre, such as scheduling and language policy.
This paper first describes the university context, then details the two initiatives used in the evaluation, describing how data from each of them can be used and interpreted. It concludes with some reflections on the process. As it forms part of a series of reflective case studies, rather than being a full research paper, more focus will be given to the evaluation initiatives than the actual results, in order to provide as much information and advice as possible to practitioners who may be interested in replicating or adapting the methods described.
Context
Otemon Gakuin University (OGU) is located in Osaka, Japan, and focuses mainly on humanities. English Café at Otemon (E-CO) was established in 2013. E-CO is a language learning space to support students’ learner autonomy, provide an English speaking environment, and promote intercultural exchange. E-CO has a voluntary usage policy. There are three full-time staff members working at E-CO: a learning advisor, a teacher, and an administrator and it is affiliated with the Center for International Studies office (CIS) which is in charge of inbound and outbound exchange programmes and various short-term study abroad programmes. Although there is no direct integration with the curriculum, E-CO offers pre-departure programmes to students who are going on study abroad programmes, and, on request from faculty, E-CO offers orientations and student activities for extra credit.
E-CO’s mission is to:
- foster positive attitudes towards the learning of English at OGU
- develop students’ English language proficiency so that they can successfully participate in a global society
- foster language learner autonomy and life-long self-directed learning skills
- generate interest in study abroad and cultural exchange programs
- nurture intercultural awareness and a sense of global citizenship
To achieve its mission, E-CO offers various kinds of support for students who are motivated to study English: learning spaces, materials, learning support services, courses for beginner and advanced level students, and different kinds of workshops.
Quantitative Evaluation Measure: An Enhanced Head-Counting System
We collect data about the number of users by using two different counting systems. When E-CO was established in April 2013, we started with simple head count of users as they entered the center. We divided the counting period into six timeframes according to five class hours and lunchtime. Head-count data is sufficient for revealing simple usage numbers. However, we were interested in language use and how students were using the centre, therefore we introduced a second counting system, which we will discuss in the next section.
Figure 1 shows the area counting sheet. In order to use this sheet, we divide E-CO into ten different areas and observe them six times a day. Some examples of the counting areas are: the Counter, Café Space, Quiet Study Space, and Group Space (see Figure 2). The middle of each class time and lunchtime was chosen as the counting time, as students are more settled than at the beginning or end of class time.
The area counting sheet is divided into three observation sections:
(1) how many students are using that area,
(2) which language they are using (English, Japanese or silent)
(3) what the purpose of their usage is (social use, study-focussed use, studying English use, or watching a movie).
From this area counting system, we can analyse the language and purpose of usage not only in each space, but also at each time of day.

Figure 1. The Original Area Counting Sheet
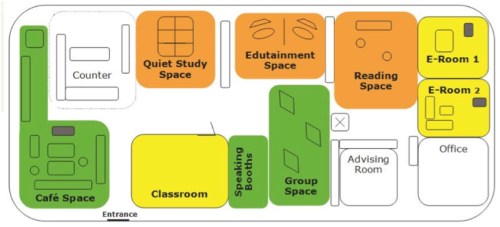
Figure 2. Map of E-CO
For language use counting, we count the language that we hear at that moment, so even if students were speaking English before counting, if students started to speak in Japanese at the moment of counting, it will be marked as using Japanese. Sometimes it is difficult to define usage. In that case, we either leave it blank or ask students casually.
In order to get a sense of whether the area counting sheet suited our purposes, a thorough pilot of the area counting data input process was conducted for four weeks in June 2013. Two changes have since been made over an 18-month period. First, following the initial pilot, another category was added. While using the first pilot sheet, we realized that it was difficult to define whether watching movies is social or for studying English, as students sometimes used Japanese subtitles and may not concentrate on learning English. Therefore, we added a Movie section and started to collect data using this revised sheet from July 2013, using the data in internal reports from September 2013.
The second change was made after using the original counting sheet for 18 months to reflect changes in E-CO. After we bought a sofa for the Reading Space, students started to use the space more. In addition, E-CO volunteer student staff became more active in talking to students, thanks to further training and their increasing confidence, so we started to see more students standing by the book shelves and explaining their own study experiences or recommending materials. Therefore, we made an updated sheet adding two new categories: Reading and Standing. This sheet has been used since April 2015 (Figure 3).

Figure 3. The Current Area Counting Sheet
Counting data results
So far, six semesters of data (from Fall 2013 to Spring 2016) have been collected and analysed. The counting data reveals several aspects of E-CO’s usage that confirm our anecdotal observations.
Firstly, by comparing usage purpose data per semester between 2013 and 2016 (Figure 4), we can see that the space usage is changing and becoming more study focussed.


Figure 4. E-CO Usage by Purpose over 3 years (spring semesters)
Secondly, as Figure 5 shows, there has been a steady increase in the amount of Japanese spoken since Spring 2014, with a particularly low proportion of English in Spring 2016.


Figure 5. Language Usage in E-CO over Three Years
As one of E-CO’s main functions is to encourage English interaction, this may at first glance be a disappointing finding, but it is not necessarily wholly negative. In part, it reflects a change in policy from April 2015 to be more tolerant of Japanese usage, in order to encourage more lower proficiency students to use the space. The majority of advising sessions are held in Japanese, and students studying together may be discussing English grammar in Japanese, and therefore fully engaged in a learning activity while using Japanese. Equally, students discussing a study abroad experience, in Japanese, may inspire others, and thus be in line with E-CO’s mission. Murray and Fujishima’s (2013) longitudinal study into an LLS in a similar context reveals the affordances that students can gain from these kind of interactions, regardless of the language they take place in, and the data on usage purpose included above does demonstrate that study-focussed usage of E-CO is indeed increasing.
However, the low proportion of English usage in Spring 2016 is a concern, and we have introduced a new initiative to try to address it. Since September 2016 a 10-minute Active English Time takes place every hour in the Café Space, in which students are expected to speak English or otherwise engage in actively learning English. One aim of this new initiative is to raise awareness among users about making efforts to use as much English as possible. Although area counting is not scheduled to take place during these times, we are interested to see whether this initiative has an effect on the overall amount of English spoken in E-CO through raised awareness.
Revising the counting data sheet
In general we consider any English usage, whether for social or study-focussed purposes, to be productive use, and Japanese usage to be productive when it is focused on learning, but less so when it is purely social. The figures above show separate data for purpose and language, but it is sometimes (although not always, see below) possible to combine this data and understand, for example, whether students who were communicating in Japanese were focused on some kind of learning activity or just interacting socially.

Figure 6. An Example of a Filled-in Area Counting Sheet
However, this becomes more difficult when a space has multiple users at one time. In Figure 6, for example, while we know the Group Space users were studying English in Japanese, it is impossible to tell whether the two Japanese speakers were using the Café Space for social use or studying English. This is a limitation of the current design of the sheet. While it would be useful to be able to collate precise data combining language and purpose, this would require a much more complicated counting system for each of the ten spaces, six times a day (see Figure 7 for an example). We are planning on piloting this new system for feasibility before the start of the next semester.

Figure 7. An Example of Revised Area Counting Sheet Idea
Qualitative Evaluation Measure: The User Experience Survey
While the quantitative data gained from the area counting project gives us a general sense of how E-CO is being used by learners, richer data is necessary in order to investigate whether and to what extent we are meeting our mission (see above).
One way in which we have attempted to gather this data is through a survey administered to users. This survey has so far been conducted twice, in July 2014 and July 2016. The research questions the survey was designed to investigate were:
- How is E-CO being used and by whom (frequency of use and of activities, what languages are being used)?
- What impact do students perceive E-CO to be having on aspects of their learning?
a. Motivation for learning English
b. English proficiency
c. Interest in intercultural exchange and study abroad
d. Autonomous learning skills
The first research question provides another data set with which the results of the area counting project can be triangulated, whereas the second question provides data to examine the extent to which E-CO is fulfilling its mission. As stated above, researching such aspects of learning gain, in terms of both language proficiency and metacognitive development, is notoriously difficult in self-access contexts, so, while the data generated are only user self-perceptions rather than objective evidence of measured gains in the relevant mission areas, we believe it is nevertheless a useful starting point.
The bilingual survey is a combination of closed and open-ended questions, and takes around 15 minutes to complete. In July 2014 and 2016, over a period of two weeks, all students using E-CO for any length of time where asked to complete the survey. The same survey was used, with a few minor adaptations made in 2016 after examining the 2014 data. Some questions, investigating language use and publicity of the centre, were added in 2016. Details of the specific questions can be found in the appendix.
Insights from the survey data
Examining the survey data from both years reveals areas of growth or decline in terms of usage, shifts in the attitudes of users and their perceptions of E-CO’s impact. As the survey has, as yet, only been conducted twice, any changes or improvements must be seen as tentative. While they could indicate a trend, two years of data is not enough to confirm this.
The survey reveals a fairly steady image of E-CO usage between 2014 and 2016, with a few small changes, both positive and negative. A similar number of responses was received each year (60 and 65), suggesting a similar number of regular users in both years. For reasons of space, this section will focus on the data for the second research question about impact of E-CO. Data collected about E-CO usage (research question 1), largely corroborates the data from the area counting sheet.
Through comparing the two data sets, we can track changes in student perceptions about the impact using E-CO is having on their learning. Changes in attitudes uncovered by the survey can tell us where we need to focus more attention in terms of achieving our mission. The number of students who consider that E-CO has had a big impact on improving their motivation, confidence and proficiency in the four language skills has increased in all areas in 2016 compared to 2014. However, there is one area where fewer students strongly agree that E-CO has had an impact: intercultural exchange, in terms of meeting foreigners, interest in foreign cultures and studying abroad. This suggests that we need to pay more attention to this area of our mission. While we have no control over the number of exchange students on campus, we can try harder in promoting E-CO as a place they can easily meet Japanese students, and have recently introduced conversation sessions run by international students.
Data-Driven Decision Making
In addition to raising our awareness about which areas of our mission require more effort to achieve, data from the evaluations has been used to inform decision-making in the centre in a number of ways, in terms of scheduling and introducing new initiatives.
There are two main ways in which the data gathered through the counting system can be used to inform scheduling. Events can be scheduled to fit in with existing usage patterns (e.g. scheduling English group speaking sessions at times when many students already tend to use E-CO in a social way) or to try to change existing patterns, for example by scheduling study-focussed workshops at a time when learners are often not using the centre very productively (i.e. when we have recorded common Japanese and social use.) This has led us to change our workshop schedule to focus on evening periods instead of afternoon periods, and has resulted in a higher attendance rate since 2015.
The finding of increased Japanese usage from the area counting, and some negative comments in the 2016 survey on this topic, has prompted us to reevaluate our language policy to actively encourage more English through the Active English Time mentioned above. While we already have anecdotal impressions of the impact of initiatives like this, the area counting data allows us to measure and confirm those impressions, and present them to university management in a more compelling way.
Reflections and Advice
While evaluating the impact an LLS is having on its users is certainly a complicated process, it is by no means impossible. This paper has shown how several relatively simple measures, both quantitative and qualitative, can be employed to reveal a picture of usage and impact. While each centre would need to adapt these methods to its own context, we offer the following advice to anyone interested in replicating any part of our evaluation.
- Area counting not only reveals usage patterns of E-CO but also gives administrative staff a chance to know the centre users better. Working at the counter, it is difficult to observe the whole centre. However, as area counting is done six times a day, staff can see what is happening by walking around and encouraging students who are studying hard. With every interaction with students there is a possibility to engage in micro-counseling, short, casual conversations designed to have students reflect their learning choices which Shibata (2012) suggests can be beneficial for students’ learning.
- It is important to decide a fixed time to count to get accurate data for comparison. In E-CO, counting time is designed to measure when students are settled into activities, so we count in the middle of each class period and lunchtime.
While quantitative head count data may be able to satisfy certain stakeholders if sufficient growth is shown, those more concerned with the quality of the experience and educational affordances an LLS can offer will want to evaluate the space in other ways. Student voices, via the survey, are an important part of this process, and enable us to demonstrate growth in ways other than simple user numbers, such as increased motivation for learning. Other methods, such as interviews and focus groups, can yield much richer data and but can be more time-consuming to implement and analyse.
- In designing a survey about user experiences of the LLS, care should be taken to include questions which address areas of the centre’s mission statement or other guiding documents, such as a strategic plan. Ideally, the evaluation methods should be built into the plan when it is developed. In hindsight, more attention to this aspect when designing our mission statement, for example by deciding the method and frequency of evaluation, we would have ensured greater emphasis was placed on the evaluation from day one.
- While student perceptions of impact can be useful, where possible findings should be triangulated using other data. For example, a reported increase in material use in the survey could be corroborated with borrowing records.
- Unfortunately, a survey administered in the LLS, not made available more widely across the university, may lack voices from less regular users. While every effort was made to approach every user over the administration period, responses were not received from those only borrowing or returning materials, or occasional users. Other methods, such as department or university-wide surveys or focus groups targeting these users, may need to be employed to understand this wider peripheral group’s experiences of the centre.
Notes on the Contributors
Katherine Thornton has an MA in TESOL from the University of Leeds and is the founder and Program Director of English Café at Otemon, a self-access centre at Otemon Gakuin University, Osaka, Japan, where she works as a learning advisor. She is the former president of the Japan Association of Self-Access Learning (JASAL), and a regular column editor of Studies in Self-Access Learning (SiSAL) Journal. Her research interests include self-access centre management, advising for language learning, and self-directed learning.
Nao Noguchi graduated from Kanda University of International Studies in March 2013. From May 2010 to March 2013 she worked at the Self Access Learning Centre in Kanda University as a member of the student staff. Since April 2013 she has worked at English Café at Otemon as its Assistant Manager.
References
Gardner. D., & Miller, L. (1999). Establishing self-access: From theory to practice. Cambridge, UK: Cambridge University Press.
Gardner, D. (1999). The evaluation of self-access centres. In B. Morrison (Ed.), Experiments and evaluation in self-access language learning (pp. 111-122). Hong Kong: Hong Kong Association for Self-Access Learning and Development.
Gardner, D. (2001). Making self-access centres more effective. In D. K. Kember, S. Candlin, & L. Yan (Eds.), Further case studies of improving teaching and learning from the action learning project (pp. 143-160). Hong Kong: Action Learning Project.
Gardner, D., & Miller, L. (2015). Managing self-access language learning. Hong Kong: City University Hong Kong Press.
Morrison, B. (2005). Evaluating learning gain in a self-access language learning centre. Language Teaching Research, 9(3), 267-293. doi:10.1191/1362168805lr167oa
Murray, G., & Fujishima, N. (2013). Social language learning spaces: Affordances in a community of learners. Chinese Journal of Applied Linguistics, 36(1), 141-157. doi:10.1515/cjal-2013-0009
Reinders, H., & Lazaro. N. (2008). The assessment of self-access language learning: practical challenges. Language Learning Journal, 36(1), 55-64. doi:10.1080/09571730801988439
Riley, P. (1996). The blind man and the bubble: Researching self-access. In R. Pemberton, E. S. L. Li, W. W. F. Or & H. D. Pierson. (Eds.). Taking control: Autonomy in language learning, (pp. 251-264). Hong Kong: Hong Kong University Press.
Shibata, S. (2012). The macro-and micro-language learning counseling: An autoethnographic account. Studies in Self-Access Learning Journal, 3(1), 108-121. Retrieved from https://sisaljournal.org/archives/march12/shibata/

